Probabilistic Machine Learning

Lab 1: Python environment

Seong-Hwan Jun

Department of Biostatistics and Computational Biology, University of Rochester Medical Center

Setting up Python environment

Overview

  • miniforge provides a minimal conda installation:
  • Editing and running code in VS Code
  • Reproducible documents with Quarto – this is how you will write up your work
  • Git and GitHub – this is how you will hand it in
  • Scientific computing using numpy, scipy and pandas

Background

  • R: a language primarily designed for data and statistical analysis (not a general purpose language).
  • Python: a general purpose programming language; packages have been developed to make it suitable for scientific computing, data and statistical analysis; widely adopted for research and scientific programming.
  • Conda: Python package and environment manager that works on Windows, Linux and macOS.
  • pip: Python package manager.

miniforge

  • We will use miniforge, which provides minimal installer that includes
    • python
    • conda: environment and package manager.
    • mamba: essentially the same job as conda, but package installation and dependency resolution are generally faster (C++ implementation).
    • Access to packages from conda-forge

What is an environment?

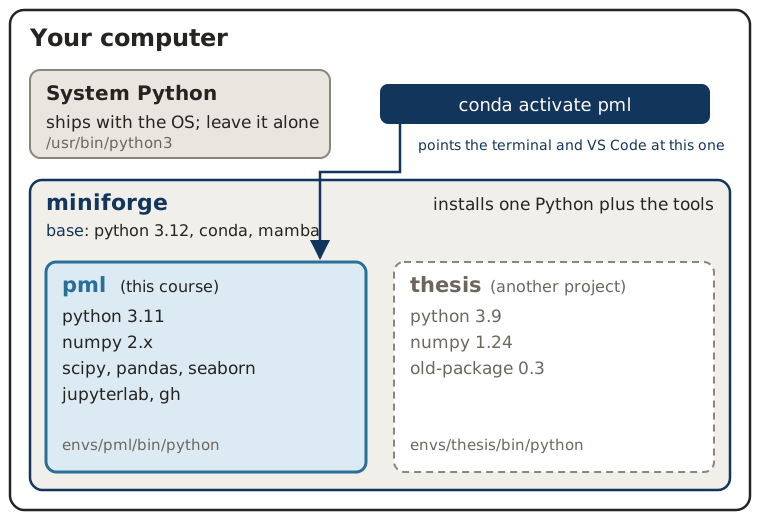
  • An environment is a self-contained Python installation with its own packages. Think of it as a sandbox: what you install for one project cannot break another.
  • Without environments, project A needing version 1.0 of a package and project B needing version 2.0 would mean uninstalling and reinstalling every time you switch.
  • conda activate chooses which sandbox your terminal, and VS Code, are looking at.

Create an environment

To create a new environment named pml with Python version 3.11:

mamba create -n pml python=3.11

Activate the environment:

conda activate pml

Install packages:

mamba install numpy scipy matplotlib pandas seaborn scikit-learn jupyterlab

Note

We can achieve the same goal using conda rather than mamba. Later in the course we will add PyTorch to this environment; there is no need for it yet.

pip

  • Pip installs packages from PyPI, the Python Package Index.
  • Some packages are not available on conda-forge and will need to be installed via pip.
  • Packages installed within an environment are only available in that environment.
  • One note: pip needs to be associated with the specific Python being used in the environment.
  • To ensure this, prepend the command with python -m:
python -m pip install some-package

Programming environments

VS Code

We will use VS Code as the default editor. One tool covers everything we need:

  • Python scripts, with completion and a debugger.
  • Jupyter notebooks, rendered inline.
  • Quarto documents, which is how you will submit your work.

Extensions to install (Extensions panel, or Cmd/Ctrl+Shift+X):

  • Python (Microsoft)
  • Jupyter (Microsoft)
  • Quarto (Posit)

The Quarto extension talks to the Quarto command-line tool but does not include it; installing Quarto itself is covered below.

Point VS Code at your environment

Creating the pml environment is not enough – the editor has to be told to use it.

  • Open the command palette: Cmd/Ctrl+Shift+P
  • Run Python: Select Interpreter
  • Choose the one whose path contains envs/pml

Important

This is the single most common thing to go wrong. If import numpy fails in a fresh notebook even though you installed numpy, you are almost certainly running the base interpreter, not pml. Check the interpreter shown in the bottom right corner of the window.

jupyter-lab, if you prefer

An interactive development environment (REPL) in the browser, well suited to analysis and experiments.

conda activate pml
jupyter lab

If you launch Jupyter from a different environment, pml will not appear in the kernel list until you register it:

conda activate pml
mamba install ipykernel      # already present if you installed jupyterlab
python -m ipykernel install --user --name pml --display-name "Python (pml)"

Then pick Python (pml) from the kernel menu.

Check your setup

Run this before you leave today. If any line fails, we fix it now rather than in week 5.

import sys, importlib

print("python", sys.version.split()[0])
for name in ["numpy", "scipy", "pandas", "matplotlib", "seaborn", "sklearn"]:
    try:
        m = importlib.import_module(name)
        print(f"  ok      {name:12s} {getattr(m, '__version__', '?')}")
    except Exception as e:
        print(f"  FAILED  {name:12s} {type(e).__name__}")
python 3.9.13
  ok      numpy        1.21.5
  ok      scipy        1.9.1
  ok      pandas       1.4.4
  ok      matplotlib   3.5.2
  ok      seaborn      0.11.2
  ok      sklearn      1.0.2
Note

Your version numbers will differ from mine; that is fine. What matters is that every line says ok. A FAILED line almost always means the wrong interpreter, see the previous slides, rather than a broken install.

Your course repository

How you will hand in work

Each of you gets a private GitHub repository for the course, shared only with me. Cloned to your machine, it is your course folder: data, notebooks, and every lab and assignment you write.

  • For each lab or assignment you make a branch, commit your .qmd there, and push it.
  • You open a pull request into main. The time it is opened is the submission time.
  • Feedback comes back as comments on the pull request. Grades are recorded in Blackboard.
  • Once you have read the feedback you merge, and main accumulates a clean record of the course.

Today you will do the whole cycle once, on Lab 1, so that nothing about it is new in week 3.

Step 1: a GitHub account

  • If you do not have one, create it now at github.com/signup. A free account is all you need.
  • Then give me two things: your GitHub handle and your NetID.

Important

I will create your repository during this lab from the list you give me. You will receive an email invitation from GitHub to seonghwanjun/pml26-<netid>. Accept it; nothing works until you do. Check the spam folder if it has not arrived in a few minutes.

Step 2: install git and the GitHub CLI

git should be installed at the system level so VS Code can find it:

  • macOS: run git --version in a terminal. If it is missing, macOS offers to install the command line tools; accept.
  • Windows: install Git for Windows with the default options.
  • Linux: sudo apt install git or the equivalent for your distribution.

gh, the GitHub command line tool, we install into the pml environment:

conda activate pml
mamba install gh

Step 3: tell git who you are, and log in

git config --global user.name  "Your Name"
git config --global user.email "you@rochester.edu"
gh auth login

gh auth login asks a few questions. Answer: GitHub.com, HTTPS, Yes to authenticating git with your GitHub credentials, and Login with a web browser. It shows a one-time code; paste it into the browser page that opens.

Check that it worked:

gh auth status

The Yes above matters: it lets git push use your GitHub login, so you never deal with tokens or SSH keys.

Step 4: clone your repository

Once you have accepted the invitation:

cd ~/Documents            # or wherever you keep coursework
gh repo clone seonghwanjun/pml26-<netid> PML

The last argument names the local folder PML. Then in VS Code, File > Open Folder and open PML. Your .qmd files go directly in PML, not in a subfolder.

PML/
├── data/          penguins.csv, and more as the semester goes
├── notebooks/     empty for now
├── README.md      the submission workflow, for reference
├── hello.qmd
└── lab1.qmd

Note

The labs read data with relative paths such as data/penguins.csv. That only works if the .qmd sits at the top of PML and you render from there. If you see FileNotFoundError, check where your file is, not the code. New data sets and notebooks will be posted on the course website; download them into data/ or notebooks/ and commit them.

Quarto

Why Quarto

Quarto turns a plain text file containing prose, math and code into a rendered document. It is what these slides are written in, and it is how you will hand in labs and assignments.

  • One file holds the narrative, the code, and the output – so results cannot drift out of sync with the text.
  • Renders to HTML, PDF, or slides from the same source.
  • Your grader can see what you ran, not just what you concluded.

Install Quarto

Quarto is a separate program, not a Python package and not part of the VS Code extension.

  • Download the installer for your operating system from quarto.org/docs/get-started and run it.
  • Then, with the pml environment active, confirm that Quarto can find Python and Jupyter:
conda activate pml
quarto check

Note

quarto check reports on every component in turn. The section to read is Checking Python 3 installation: it should list a path containing envs/pml and say that Jupyter was found. If it does not, the interpreter fix from earlier applies here too.

Your first .qmd

Create hello.qmd in your PML folder:

---
title: "Lab 1"
author: "Your name"
format: html
jupyter: python3
---

## A short report

The mean of a sample of standard normals should be near zero.

```{python}
import numpy as np
rng = np.random.default_rng(0)
x = rng.normal(size=1000)
print(f"mean {x.mean():.4f},  sd {x.std():.4f}")
```

Rendering

From the terminal, with the environment active:

conda activate pml
quarto render hello.qmd

Or in VS Code, open the file and press the Render button.

Note

The jupyter: python3 line in the header tells Quarto to execute Python. If rendering fails complaining about a kernel, it is the same interpreter problem as before – Quarto is not seeing your pml environment.

Core libraries

Numpy

Python is a general purpose programming language.

  • There is no native support for numerical computation, e.g., vectors, matrices, and probability distributions are not native to the language.
  • numpy provides optimized framework to represent multi-dimensional arrays along with basic operations and sampling from basic distributions.

Numpy: arrays

import numpy as np
a = np.array([1.2, 3.2, 5.0])
print(a)
print(a.shape)
[1.2 3.2 5. ]
(3,)
import numpy as np
mat = np.array([[1.2, 3.2, 5.0],[-2.1, -4, -5]])
print(mat)
print(mat.shape)
[[ 1.2  3.2  5. ]
 [-2.1 -4.  -5. ]]
(2, 3)

Numpy: random numbers

rng = np.random.default_rng(seed=42)      # a seeded generator

x = rng.normal(loc=0.5, scale=1.2, size=2)
print(x, x.shape)

X = rng.normal(loc=0.5, scale=1.2, size=(3, 2))
print(X, X.shape)

print(X @ x)                              # matrix-vector product
[ 0.8656605  -0.74798093] (2,)
[[ 1.40054143  1.62867766]
 [-1.84124223 -1.06261541]
 [ 0.65340848  0.12050889]] (3, 2)
[-0.00582643 -0.7990746   0.47549156]

Important

Use rng = np.random.default_rng(seed) rather than np.random.normal(...). The bare functions share one hidden global generator, so results depend on what else has run. A named, seeded generator makes your analysis reproducible – and everything in this course will be seeded this way.

Random number generation in numpy.

Scipy

scipy builds on numpy, providing functions and algorithms to facilitate scientific computing:

  • statistics, evaluate PDF, CDF, compute summary stats, etc.
  • optimization
  • special functions
  • integration, ODE, signal processing, etc.

Scipy: scipy.stats

import scipy.stats as ss # declare namespace for the library
mean = 1.2
std_dev = 1.1
x = 0.3
pdf_value = ss.norm.pdf(x, loc=mean, scale=std_dev)
print(pdf_value)
cdf_value = ss.norm.cdf(x, loc=mean, scale=std_dev)
print(cdf_value)
p = 0.95
x_value = ss.norm.ppf(p, loc=mean, scale=std_dev)
print(x_value)
# Can also sample (alternative option to numpy).
samples = ss.norm.rvs(loc=mean, scale=std_dev, size=10)
print(samples)
print(samples.shape)
0.25951015172582276
0.20662668774682025
3.0093389896466194
[ 2.21953606  0.37744665  0.84890512  2.52104119  1.50835674  1.98677489
  1.07378508 -0.28785959 -0.36646241  2.31188441]
(10,)

Pandas

Pandas: a small data frame

import pandas as pd

df = pd.DataFrame({"patient": [1, 2, 3, 4],
                   "group":   ["a", "b", "a", "b"],
                   "score":   [3.1, 4.8, 2.9, 5.2]})
print(df)
print()
print("rows where score > 3:")
print(df[df["score"] > 3])
print()
print("group means:")
print(df.groupby("group")["score"].mean())
print()
print("as a numpy array:", df["score"].to_numpy())
   patient group  score
0        1     a    3.1
1        2     b    4.8
2        3     a    2.9
3        4     b    5.2

rows where score > 3:
   patient group  score
0        1     a    3.1
1        2     b    4.8
3        4     b    5.2

group means:
group
a    3.0
b    5.0
Name: score, dtype: float64

as a numpy array: [3.1 4.8 2.9 5.2]

Plotting

  • Matplotlib, Seaborn, Plotnine.
  • Interactive plots: Plotly, Altair.
  • We will mostly use seaborn, which builds on matplotlib and works directly with pandas data frames.

Plotting: one example

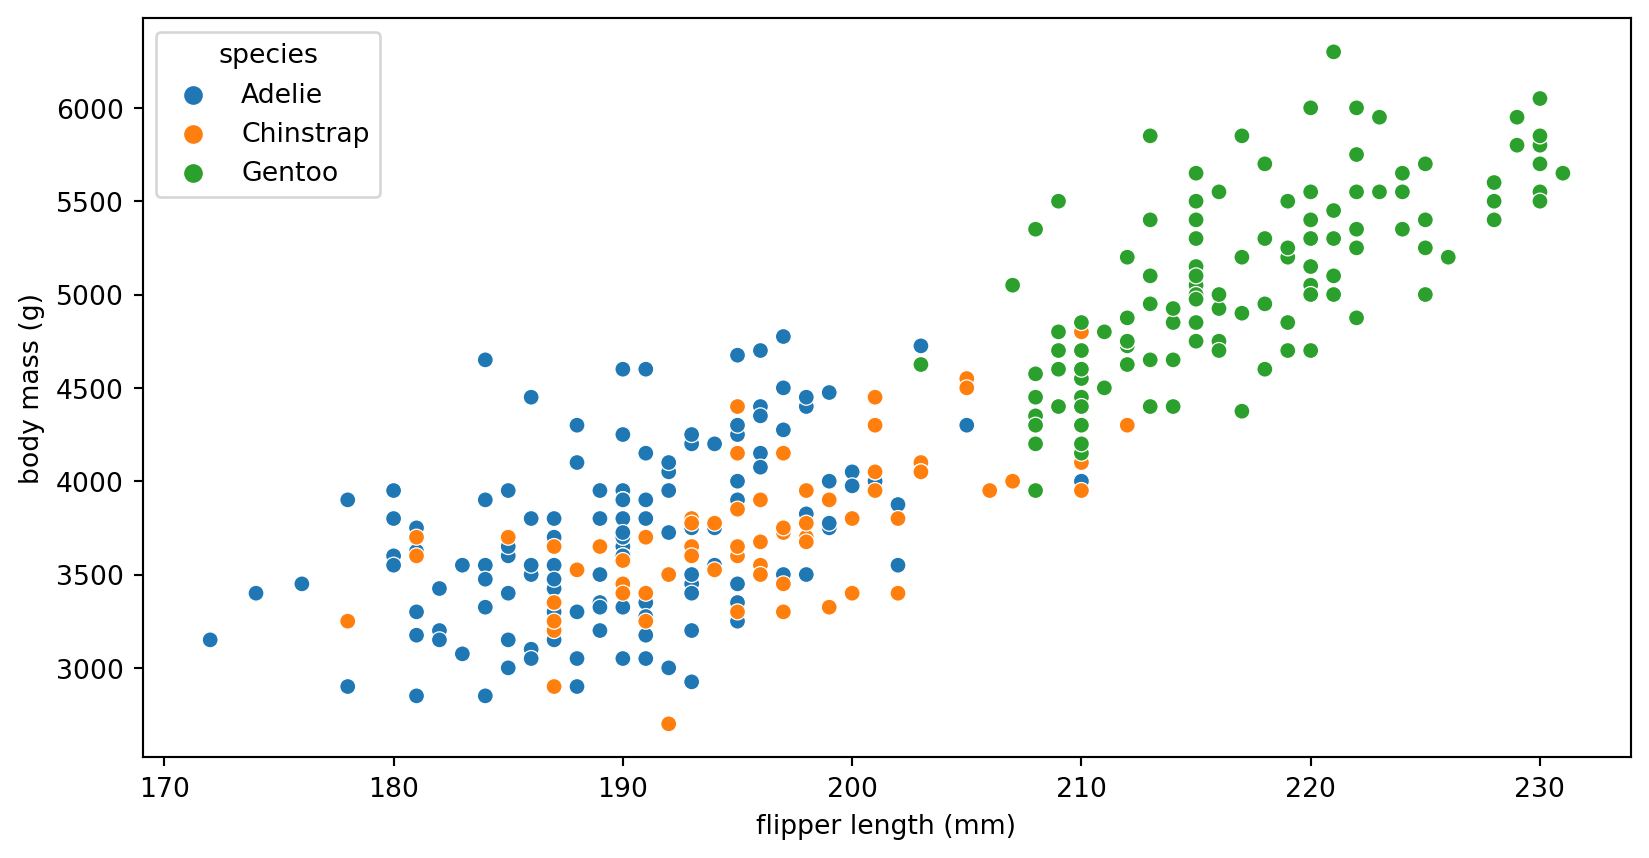
The penguins data set, in your repository’s data/ folder, has one row per bird.

import matplotlib.pyplot as plt
import seaborn as sns

penguins = pd.read_csv("data/penguins.csv").dropna()
ax = sns.scatterplot(data=penguins, x="flipper_length_mm", y="body_mass_g", hue="species")
ax.set_xlabel("flipper length (mm)")
ax.set_ylabel("body mass (g)")
plt.show()

Exercises

Work through these now

Put your answers in a single lab1.qmd at the top of your PML folder. Each block has an assertion; make it pass.

1. Seeded sampling.

import numpy as np
rng = np.random.default_rng(0)
x = rng.normal(loc=2.0, scale=3.0, size=10_000)
# TODO: print the sample mean and standard deviation; the assertions check them
assert abs(x.mean() - 2.0) < 0.1
assert abs(x.std() - 3.0) < 0.1

# TODO: make a second generator with the SAME seed, draw a second sample y of the
#       same size, and show that y reproduces x exactly (np.array_equal)

2. Densities.

import scipy.stats as ss
grid = np.linspace(-10, 14, 5000)
# TODO: evaluate the N(2, 3^2) density on `grid` using ss.norm with loc=2, scale=3,
#       and integrate it numerically with np.trapezoid (np.trapz on older numpy)
assert abs(area - 1.0) < 1e-4
# TODO: for the same distribution, compute q = ss.norm.ppf(0.3, ...) and check that
#       ss.norm.cdf(q, ...) returns 0.3
assert abs(p_back - 0.3) < 1e-10

Exercises, continued

3. Tabular data.

import pandas as pd
penguins = pd.read_csv("data/penguins.csv").dropna()
# TODO: print the number of rows and the number of distinct species
# TODO: mean bill_length_mm for each species, as a pandas Series named `means`
assert isinstance(means, pd.Series)
assert set(means.index) == set(penguins["species"])

4. A picture.

import seaborn as sns
# TODO: histogram of bill_length_mm, coloured by species (sns.histplot).
#       Keep the returned Axes object as `ax` and label both axes.
assert ax.get_xlabel() != "" and ax.get_ylabel() != ""

5. Hand it in. Render lab1.qmd to check that it runs, then follow the next slide.

Hand it in: branch, commit, push, pull request

From a terminal in your PML folder, with pml active:

git switch -c lab1                      # a new branch for this lab
git add lab1.qmd                        # stage the file (not the .html; it is ignored)
git commit -m "Lab 1"                   # record it
git push -u origin lab1                 # send the branch to GitHub
gh pr create --title "Lab 1" --body "Lab 1 submission" --base main --head lab1

gh pr create prints a link. Open it; that page is your submission, and it is where my comments will appear.

Note

VS Code’s Source Control panel does the same thing with buttons: create branch, stage, commit, publish branch, then Create Pull Request from the GitHub extension. Use whichever you prefer; the result is identical.

After feedback. On the pull request page, press Merge pull request. Then, locally:

git switch main
git pull

Your next branch starts from this updated main. If you forget the pull, the next pull request will confusingly include Lab 1 again.

Going further

Exercise 1 asked you to reproduce a sample exactly from the same seed. Why will this matter when we start fitting models with random initialization?